I thought it might be beneficial to include up to date metrics on the ACC. These are intended to give us a sense of whom we are at this point in the life of the ACC.
It is worth explaining that those in ministry identified as “retired” are those who are continuing to offer ministry despite being retired.
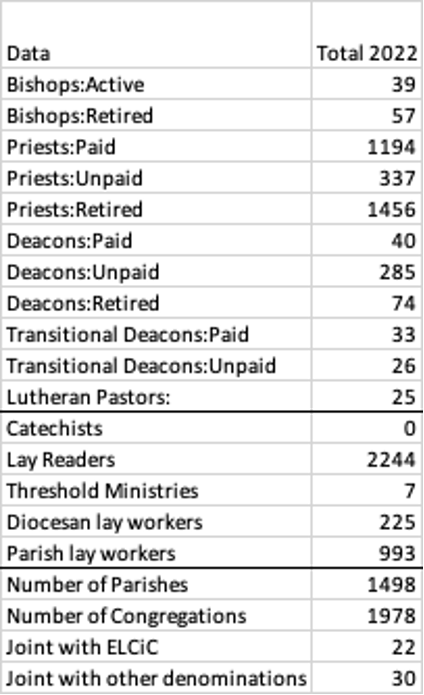
The table above contains simply the data for 2022, with no comparisons. After looking at the data we have for these metrics I concluded that the metrics in which there was significant variation were unstable enough so that those variations were likely to be misleading.
Ordained ministers
Given that we have 30 dioceses the data is showing that there are an average of 1.3 active bishops per diocese and 2 retired bishops per diocese. Of course, the actual distribution does not quite reflect this, but only a few dioceses do not have at least one retired bishop.
We have almost 1300 paid priests, who may be part time, and 1800 unpaid and retired priests.
Given that there are 1500 parishes it is clear we are a long way from having one paid priest per parish. Again geographical variations are significant here. The lowest ratio is one paid priest per four parishes, except for one diocese that has no paid priests, and the highest ratio is 1.2 priests per parish. In most dioceses the number of retired priests is around the same as the number of paid priests. Unpaid priests are widely scattered but tend to be more populous in certain dioceses which presumably have promoted this ministry.
It is notable that diaconal ministry is seldom paid, with 7 times as many unpaid deacons as paid deacons. But around half of dioceses have at least one paid deacon. As a side note I should add that a recent survey I conducted established that 60% of deacons are women.
I would also note the significant number of unpaid transitional deacons (ie priests in waiting). This number is almost that of the paid transitional deacons. It suggests a breakdown in the established system of potential ordinands funding their own way through seminary and then finding paid roles.
Parish lay readers and workers
The numbers of lay readers and the numbers of parish lay workers both appear to be falling. These would seem to be different indicators of decline. The reduction in lay readers would suggest that the lay reader pool of volunteers is declining, maybe as a demographic issue. The decline in lay workers suggests that parishes cannot afford to pay their lay workers. Both of these assumptions would then suggest that the work of the readers and workers is having to be picked up by someone, as the number of parishes and congregations is not declining at anywhere near the same rate as that of readers and workers.
It should also be noted that the numbers of diocesan workers is roughly stable, if not slightly increasing
Parishes and congregations
The average diocese would have 50 parishes and 66 congregations. The average parish would have 1.3 congregations. Again we should note that these do not represent the wide regions variations – including in geographical size of parish. For example, Toronto has four times as many congregations (almost 200) as the Arctic (50)!
I believe that the joint congregations referred to in the data are primarily if not exclusively with the United Church of Canada. We do not have data addressing whether Lutheran pastors are ministering primarily in ACC congregations which are joint with the ELCiC (Evangelical Lutheran Church in Canada).