This will be the first of two short reports based on Anglican Church of Canada data from the 2022 diocesan returns. The second report will look at more structural metrics. This report is based on the parish statistics.
Data quality issues
The first things that needs to be said about the 2022 data set is that there were significant missing data items in the data set. These have amounted to 7 of 30 dioceses with some or all missing items. This is not untypical compared to other jurisdictions but is nevertheless disappointing when we have recently had 100% response rates. The missing data has taken a number of forms. In two cases it is a complete lack of a return. In other cases it is some missing items. For all of these missing data items I have used an iterative process to obtain an approximation for the appropriate value, based on previous years data and the comparisons with national averages.
I should also say at this point that diocesan metrics have shown a much greater degree of variation than normal. This meant that in some metrics a diocese looked significantly better or worse than the average. There were no cases where a diocese did unequivocally better in all metrics. In some cases this degree of variation has been particularly evident because of the comparison with 2019. 2019 was a notably bad year for some dioceses on a number of metrics. Thus comparisons with 2019 have made those dioceses look as if they were doing well coming out of the pandemic. Looking at the 2018 data gave a more realistic assessment.
In all of the above variations, there is no pattern that I can discern. The issues have affected large and small dioceses, across the country, and in the north and south. As usual, I will not be reporting on individual dioceses in this document, but will be making the data available to those dioceses through the General Secretary’s office by request.
Overall change 2019-2022
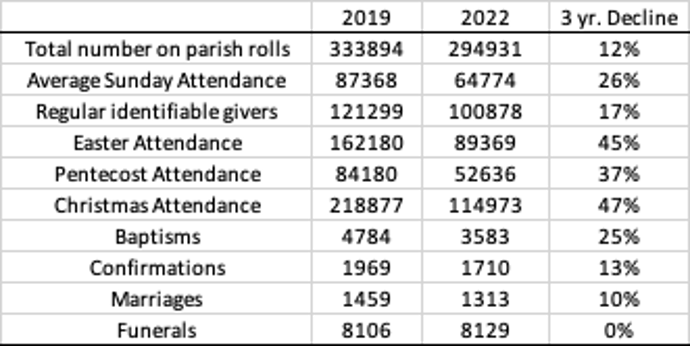
The first thing to note in order to make sense of the data above, is that up to 2019 ACC mission metrics had been in steady linear decline at about 2.5% per year since 2001 and beyond. The above changes are for 3 years so the decline should be around 7.5%. The numbers above are significantly higher than that.
I should note that the figures in the table above use a base of 2019 values to calculate the percentage decline. However, this inflates the percentage decline compared to using the 2001 values. These were the base for the 2017 report “gone by 2040”. These figures make the parish rolls decline around 6%, ASA around 14%, and the donors around 10%.
Going back to the individual metrics, the most concerning values must be those on attendance, both the individual Sundays and the ASA. We appear to have lost 1/4 of our attendance over Covid and almost half of the attendance at Christmas and Easter. The fact that the Christmas and Easter declines are similar suggests that this is not due to a persistence of Covid concerns. Whilst Easter 2022 attendance might have been affected by Covid, Christmas should not have been. Both Christmas and Easter numbers show the engagement with the wider community, as well as with “CnE” Anglicans. Pentecost numbers show the gathering of all the regular members of the churches. It can be seen from the 2019 statistics that the ASA and Pentecost numbers are similar. But in 2022, the Pentecost attendance is significantly lower than the ASA. This is a much greater differential than we have seen in previous years.
In contrast to the above, the metric for parish rolls shows a decline which is more moderate especially when used against a base of 2001 numbers. However, it should be borne in mind that parish rolls are a lagging indicator of membership. Rolls may be updated rarely, and particularly pruned rarely. It can be hard to get off the list! Every diocese has its own rules about the parish roll. For some it is a contact list, for others it is a list of everyone in certain geographical communities.
Occasional offices (Baptisms, Confirmations, Marriages and Funerals) were interesting for 2022. Many of these may have been postponed during the pandemic, but still the numbers for baptisms had fallen substantially from 2019 to 2022. In some dioceses the numbers of confirmations showed a significant increase but the overall numbers were down. Marriages were only down by a moderate amount, but again this lesser decline might have been due to those postponed during the pandemic.
Denominational comparisons
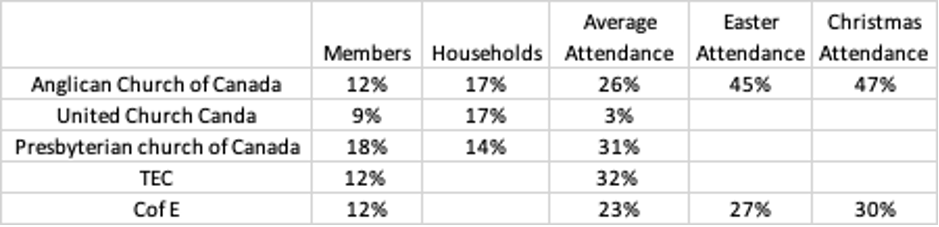
It is helpful to make a comparison with other denominations and Anglican churches. I should note that these are rarely exact comparisons, as each church uses metrics in a slightly different way. For example the membership number I use for the CofE is the “Worshipping community” value.
Overall the chart shows that the ACC experience has been typical. Our membership decline matches that of the CofE and TEC, and our attendance decline sits between these two. The
CofE reports lower declines for Easter and Christmas, but their declines are still very substantial.
The UCC has a puzlingly low decline in average attendance, but the Presbyterian church attendance decline exceeds that of the ACC.
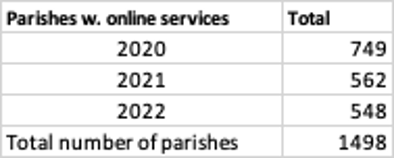
Online services
Given all the above, it is a relief to report some genuinely good news. The provision of online services seems to be stabilising at around 1/3 of parishes. It should be noted that this metric for online services is becoming the generally accepted metric in church statistics. Whilst it does not attempt to evaluate the number of those connecting in through online services, it is nonetheless useful to establish the provision of those services.