The CofE has released the Statistics for Mission 2022, so are they good news, bad news or no news? Well as I will explain, the broad answer appears to be yes. Included also are some interesting occasional statistics on the social services offered by churches. And there some really interesting nuances around “soft” and “hard” numbers. Finally, I want to ask who cares about these numbers.
NumbersMatters is also available as a podcast here
Like most church stats nurds and non-nurds I have been awaiting the CofE stats for a while. I don’t know how much fanfare they get in the UK, aside from a Church Times article, but the first I generally see of the Statistics for Mission is an item on Thinking Anglicans. (See links section below) I generally read the initial comments before I have looked in detail at the report itself. I sometimes also read the CofE press release before reading the report, but mostly not as it is bad for my blood pressure.
As usual the report from the CofE statistics unit is excellent: professional, well written, and judged just right for its audience. There are a few items I will pick up on because this is the first time I have commented in public on the CofE Stats for Mission, and because the audience for this blog is much wider than the CofE. But this is how church stats reports should be. Dr Eames, who is the named author, also makes available the excel spreadsheet with all the data. Nurds rejoice! But not just church stats nurds. The file contains the diocesan data for many of the metrics. There are many questions which this diocesan data can both ask and answer.
I am not going to go into detailed analysis of the data itself. I think that would be redundant because the Statistics unit team have done such a good job. There is a lot of data in the report and each person reading this will have their own perspective on what is significant. I would invite you to comment on particular issues either on the Thinking Anglicans website or on the Church Statistics Facebook page (see below).
Timelines matter
Enough of the flannel, what does the report say. Well, it really depends who is reading it and what their position is. Take a look at the Thinking Anglicans discussion and you will see what I mean. Read the CofE Press release and you will see what I mean. And these two sources point at the significance of timelines. Those timelines shape whether you see the data as good news, bad news or no news.
The CofE press release takes the view that the important timeline is the last year – 2021 to 2022. And thus they are able to report that the CofE is growing! Again! It is growing substantially!! Weekly attendance has gone from 605,000 to 654,000. Worshipping community size has gone up 20,000 in one year. This, on top of the growth which happened from 2020 to 2021. It is all good news for the CofE.
Dr Eames has taken the view that the important timeline is from 2019, before Covid, to 2022. The change through Covid appears to be the theme of the report, with a caveated reference about whether we are back to ‘normal’ now. Many of the data tables and comparisons in the report use the timescale 2019-2022. This gives a very different picture to the 2021-22 view. The CofE has shrunk on many metrics by over 20% in the period before and “after” Covid. There are some metrics, particularly associated with “occasional offices” – baptisms, weddings etc – where the numbers are stable or there has been an increase. There are significant metrics like worshipping community size where the decline has been much less than 20%. One sad but helpful table (Table 6) showed how the typical (median) CofE church has changed in the last 3 years – losing 8 members of its community, 3 from its usual attendance and 25% of its Christmas and Easter attendance. The data gives a picture of the Church up and down the country. The 2019-2022 timeline shows a story that is primarily bad news.
A third perspective is that this is not bad news but no news. The shape of the decline (if that’s what it proves to be ) is just what I and many others would expect. We have seen this kind of step-down coming for at least a year. It is neither significantly better nor worse than we would expect. Dr Eames includes some graphed data going back to 2009 (See above). Here we can see the steady decline of the period up to 2019 and the step down through Covid. The big question is what happens in the next 3 years, particularly in the data from 2023.
To be clear though, it could have been either much worse or much better. Covid could have been the catalyst that called people back to church. Or the lockdown(s) could have broken the habit of church for many more people. To date the figures we see are still figures of a resilient church which has picked itself up and carried on.
So timelines matter. The challenge of the next few years is to follow what the data does. We may see a continued recovery. We may see a return to the pre-Covid decline, albeit from a step down. Or there may be another option. One comment by my colleague Peter Misiaszek, on the Thinking Anglicans discussion, suggested that the issue for the church into the late 2020s is not primarily membership or attendance, but lay leadership.
Church Social work through Covid
One set of data which was also both encouraging and challenging was the data on churches which are engaged in some social work. 77% of CofE churches were involved in some kind of project. The overall figure is down slightly from the identical question asked in 2019. Notably, and increasing from 2019, was the number involved in foodbanks or community cafes.
The detail given in this section of the report is very helpful, as is the clear presentation of the data in graphs which I hope non-nurds can interpret. A variety of types of engagement and of social service are identified. The section is a great example of the benefits of being able to ask individual churches what they are doing in a specific area of ministry and outreach.
Again one might ask if this is good news – that ¾’s of CofE churches are engaged in social work, or bad news – both that this work is necessary, and that ¼ are not engaged!
Harder and softer metrics
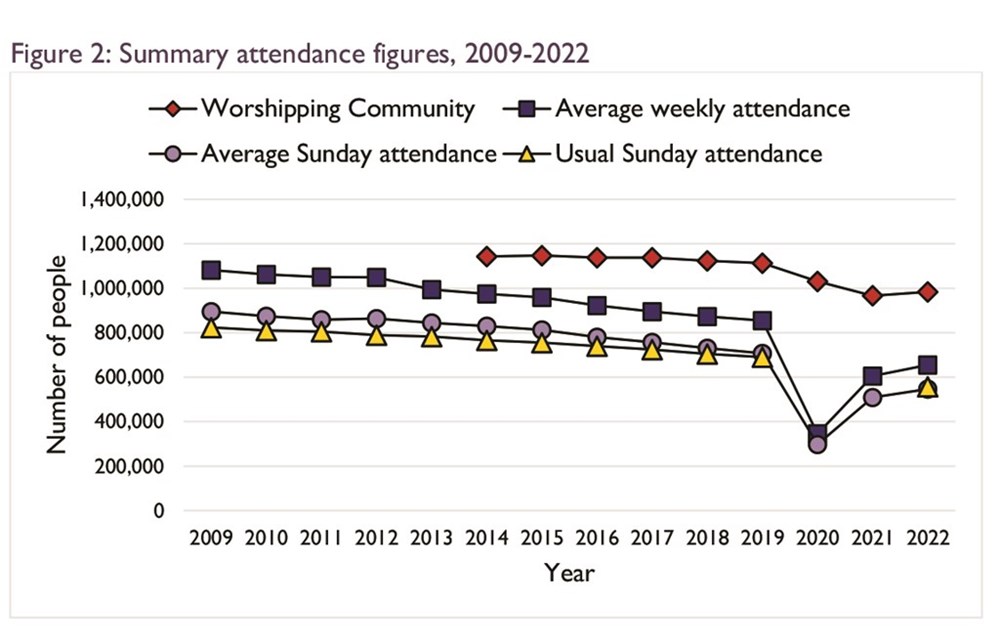
One standout item in the report, which is clearly visible in the graph above, is the slight dip in numbers for “worshipping community” compared to that for attendance metrics. I would suggest that the fact that this number has a slight dip and a smaller decrease is because it is a softer metric. In this section I want to address some of the different metrics included in the report which may cause confusion, especially to those outside the CofE. Why do we need so many versions of attendance (USA, AWA ASA) and membership (Electoral roll, worshipping community)? This section will I hope be a Caveat Emptor, to those examining the report.
Worshipping community is a number which the CofE has been collecting for almost ten years. It is meant to represent the total number of people who might consider a church to be “their” church, but the definition (from here) is pretty vague and open to interpretation and expansion:
“anyone who attends that church regularly. It includes activities such as fellowship groups and other activities that have a distinct act of worship or prayer. It also includes acts of worship not on church premises (e.g. at a school or community centre).”
Significantly for my purposes, worshipping community is a number taken from the mind of the person who fills in the forms. It is not a count, it is an estimate. It is a soft number. The number remained high because those who filled the forms through Covid did not consider people to have left their worshipping community. They may or may not have been correct, the point is that “worshipping community” size was up to a person to estimate not count.
That contrasts with some attendance measures, like Average Sunday Attendance and Average weekly attendance. These come from numbers recorded in a vestry book, counted week by week….. Well, actually, counted just in October and averaged for those four (or five) Sundays. These, alongside Christmas and Easter attendance, are hard numbers. No estimation is required. There is another attendance number, Usual Sunday Attendance, which is again based on an estimation, a perception of what the “normal” Sunday looks like….. However, the graph above shows Usual Sunday attendance following Average Sunday attendance pretty closely.
There is another reason that worshipping community should be taken with “more caution than usual” as Dr Eames says in p23 of the report. The “worshipping community” figure is expected to include numbers from “Church at Home”. I have written elsewhere about the issues of equating online services with in-person services. Church at Home includes not only online service numbers plus services that are telephoned, emailed or posted. Dr Eames, makes the point of the point in p 11 of the report, commenting on Church at Home attendance numbers as not really “meaningful”.
Church at Home service numbers are also an encouraging metric because they demonstrate the continuing commitment of the CofE to reach outside the walls of its church buildings to those who cannot, or who choose not to, attend in person. It is good, from this perspective, to include those people as part of the worshipping community, abeit with a caveat about the validity of the number. It is perhaps disappointing to see the numbers dropping from 71% of churches holding such services in 2020, to 51% in 2021 and 36% in 2022.
All of this may sound as if I am dismissing these “softer” numbers or maybe critiquing their inclusion in the statistics for mission data. That is not my intention. I have nothing but respect for Dr Eames and his team. I understand the need for a “worshipping community” metric and Usual Sunday Attendance. The CofE statistics unit is very transparent and self-aware in the nature of the numbers they include. They are the most qualified and experienced experts in church statistics that I am aware of anywhere in the world. In particular they know their statistics and their context better than anyone else. I commend the methodology section at the back of the report to anyone, alongside the actual data collection form (for those who don’t have to fill it out!). These two pieces of “small print” are tremendously useful in understanding the headline figures at the front of the report.
So who cares?
Like all Church stats nurds I care about the numbers. I believe that through the numbers we see God at work in our churches and in our world. I believe that the numbers should cause us to pay attention to what is happening and to focus our work appropriately. But I recognise I am in a small minority.
It was interesting to note that whilst the CofE General Synod was meeting last week, the statistics report was not on the agenda. I recognise that there were other items of significance which the CofE needed to address. But it made me wonder who actually cares about this report?
In my work at the ACC the data I collect is used to determine how many delegates each diocese can send to our General Synod. It is the stick which we use to drive in the data. I do not know how the Statistics for Mission data is used institutionally. Maybe some of those reading this will post answers on the Facebook or Thinking Anglican sites. I presume that the CofE dioceses each have access to detailed breakdowns of the data from their diocese. I know some dioceses even have their own stats person or team!
The CofE press release suggests the function of the data is to give good news about the church, in a spin on the data which is frankly risible. The 2022 set of data was really important because it describes the extent (so far!) of the “post-Covid” recovery. Yes, it was broadly predictable, but predictions can be wrong. It was not really bad news, unless you just weren’t paying attention! It was more like no news.
So who does this data help? How will it be used through 2024 to shape church policy at national, diocesan and local level. Will more churches be encouraged to continue Church at Home? Will dioceses resource social services or ask the government for funding for the great work the CofE is doing? Will this data be fodder for the reputedly increasing numbers of diocesan mission managers? Will this data be used as part of an evaluation of CofE experiments like Fresh Expressions?
Next years data form is available and it will include a question about New “Congregations/ New worshipping communities”, as well as about congregations which have “come to an end”. The inclusion of these two questions is intriguing and maybe even controversial. I hope that through all of this data we will see God at work and walk alongside God’s Spirit in these challenging times.
Links
The full report from the statistics unit is here
The excel spreadsheet file with the data is here
The Church Times article can be read here
The CofE press release can be read here
The Thinking Anglicans (TA) discussion, including comment by the author, Dr Ken Eames is here. I expect other blogs on this topic will be referenced on the TA site
Comment on this edition of NumbersMatters
by joining the “Church Statistics” Facebook group,
or by emailing me – nelliot(a)national.anglican.ca