The Episcopal Church (TEC) has released their annual parochial statistics for 2022. After a brief read three questions came to my mind – and after a more detailed look myself, and reading other commentators, those three questions are still there. The three questions are: Is TEC bouncing back from Covid; Where is the growth happening; and what about the missing data? For those who have may have missed it, the reports are available at https://www.generalconvention.org/parochialreportresults
I particularly commend the “Fast Facts” summary, and the analysis (which is particularly useful for those with a limited knowledge of TEC). The data that I will primarily be commenting on is in the fast facts. The other documents contains breakdowns of various metrics for each diocese
As the Church Times and other have reported, there is significant bad news here for TEC. If you are interested, you can see a critique on Anglican.ink and a linked piece on JuicyEcumenism.com. Both pieces are written by Jeff Walton, a TEC member, and conservative think-tank member and blogger. https://anglican.ink/2023/09/29/episcopal-withering-on-the-vine/
His comments included the following “Optimists might protest that Episcopalians are still in the process of returning to church, but let me disabuse readers of that notion…..”
Bounce back from Covid?
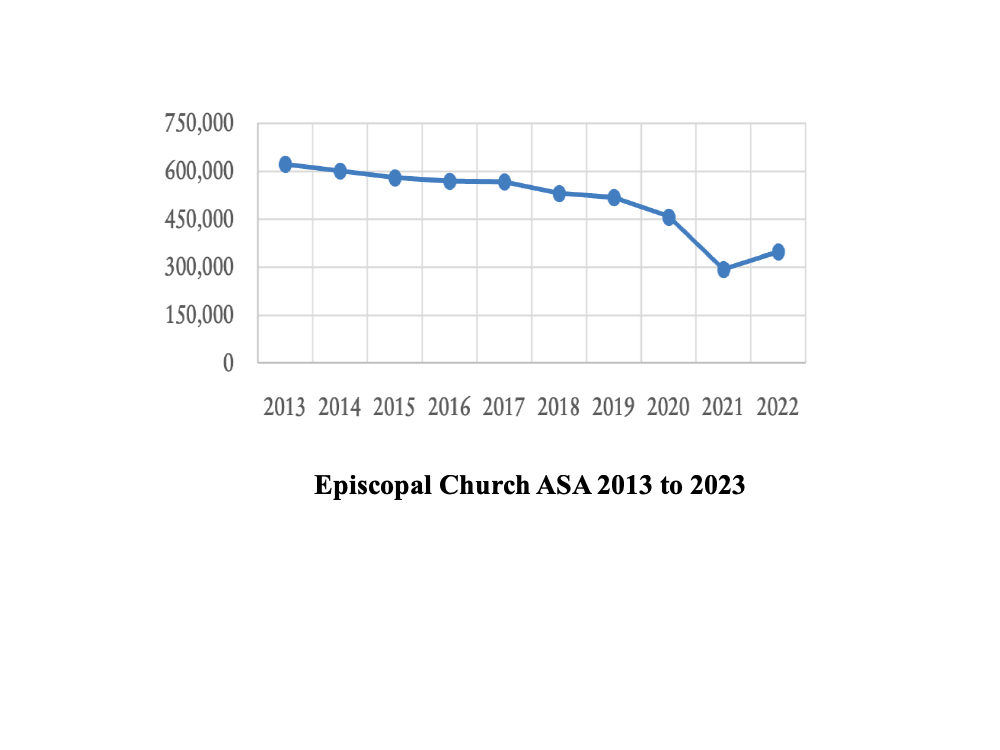
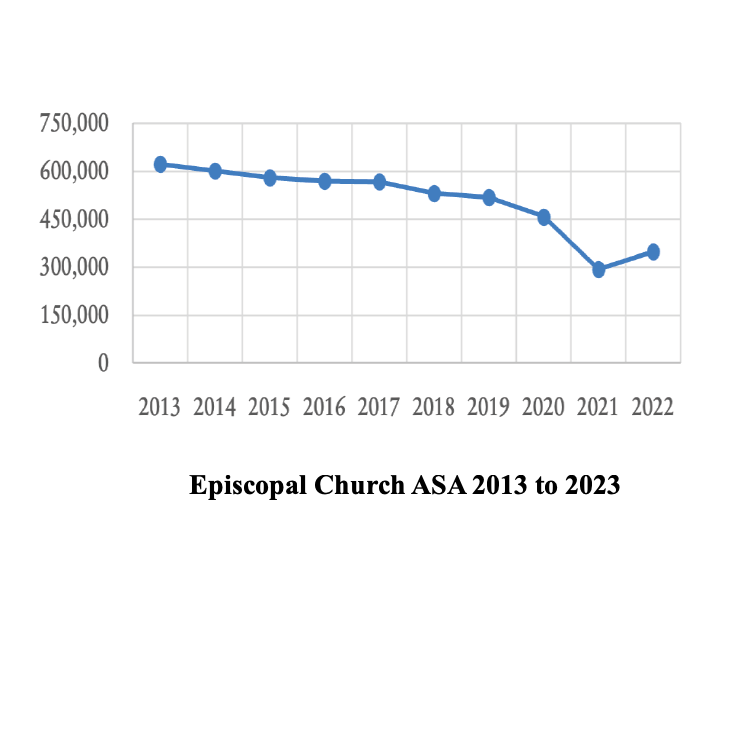
The extent of a bounce back from Covid must be the key issue for church statistics in the next few years. The ASA numbers are shown in the graph above, which is taken from the TEC analysis. TEC gained about 20% on its 2021 ASA (Average Sunday Attendance). But as the Church Times (29th September) noted, this still left ASA down 44% from ten years ago.
Interestingly the Church Times suggests that the decline in TEC attendance was due to ” the effect of internal disputes.” However, the TEC data shows that before Covid ASA was declining at around 2.5% per year. This is about the same as the ASA decline for the ACC from 2001-2017. In the same period the CofE’s ACC was declining only slightly less at about 2% per year. These suggest that the decline is much wider than “Internal disputes”.
There is a lovely little section in the statistics which speaks to the significance of the post-Covid bump. It shows that 31 small congregations increased their ASA from less than 10 to over 10. Similarly, the median Sunday worship attendance went from 21 to 37. As a retired pastor of a small church, I was encouraged to think of churches where those changes will make a big difference
Where is the growth?
One surprise for me as I looked at the Fast Facts sheet, was the significant number of TEC Church which are growing. 12% grew more than 10% of their membership over the last 5 years. I presume this means their membership in 2022 was more than 10% greater than their membership in 2017. Now OK, this is down from 21% growing churches in 2018, but it still means that TEC has around 750 growing congregations. Further there were 7% of churches which grew in ASA over the same period. My immediate response was to want to know where these churches are. Are they rural or urban, in the north or the south?
A look at the breakdown of ASA by province and diocese was not helpful in answering these questions. There is definitely a wide variation in change in ASA both by province and diocese. For example on the US west coast, the diocese of LA only grew its ASA by 3.3% – a very minimal bounce-back – whilst Oregon had a 40% growth. South-east Florida grew 10% and South-west Florida grew 20%. Of course, there may be all kinds of factors at play here and doubtless there are variety of explanations – including the inevitable theological ones.
But what the Fast Facts also gave was some statistics for individual churches. They told us the largest churches by membership and ASA (in Houston and Florida respectively). And they gave me a serious case of data envy. I get my data from the dioceses so have limited access to individual churches… and the prospect of being able to get parish by parish answers to national questions like “where is the growth” really intrigues me. I hope someone is getting the answers.
Missing data
So to my third question. Because my other instant response to the Fast Facts sheet was “where is the on-line service data?” There was no online data in the fast facts or anywhere else in the published data. The data reported in the Fast Facts sheet contains the same data items as was reported in 2019, and probably for some years before that. I went looking at the data collection information for TEC parishes. I discovered that they have gathered, at least for 2022, data items for online and hybrid services of a variety of types – eucharist, daily offices, marriages and burials. Yes, you read that right, online marriages and burials. In the post-Covid church scene those numbers are definitely interesting both on a snapshot and historic basis.
TEC also collect but do not appear to publish in-person attendance for Christmas and Easter.
These to my view are highly significant measures of a church’s connection with the wider community, with semi-lapsed members, and thus with those who might, just might, be interested in joining the church.
Again, my hope is that someone is looking at these metrics and extracting useful information from them. As we continue to face the challenges of the post-pandemic world we need to know what is happening in our own and sister churches in a much detail as possible.